The product gets more complicated
Features accumulate without a clear purpose. Customers have more to understand and engineering inherits more to maintain.
Product strategy
In Shorter Loop, a strategy is a set of linked objects: an objective, the opportunities that could move it, the solutions proposed for each opportunity, and the experiments that test them. Sage drafts opportunities and solution ideas from your customer feedback and research. The team reviews them and makes the decisions. The example below follows one team through a churn objective.
The example This page uses an anonymized example from a real customer use case you can open and inspect. The figures used on this page come from that workspace.
For months, the team had treated onboarding as the cause of churn without evidence.
Challenge yourself
Your team delivers regularly. Roadmap items are completed. Releases go out. But customer problems remain, retention does not improve, or the business metric the work was supposed to affect barely moves.
This usually means the team has become a feature factory - good at producing output but not at creating impact.
What happens in the feature factory?
Features accumulate without a clear purpose. Customers have more to understand and engineering inherits more to maintain.
Features ship successfully, but the outcomes you care about - retention, conversion, revenue - do not improve
Product managers administer a backlog. Designers polish predetermined solutions and engineers implement tickets. There is less time to investigate the problem or test assumptions.
A proven way to structure the decision
An Opportunity Solution Tree gives teams a structure for doing this. It connects the outcome the team wants to change to customer opportunities, possible solutions, and the experiments used to test the assumptions behind them.
Teams risk spending months building full features only to discover after launch that they didn't move our target metrics—resulting in product bloat, wasted budget, and missed goals.
An Opportunity Solution Tree flips this: it maps our business outcome to real user problems first, lets us compare multiple solutions side-by-side, and uses small 2-day experiments to test risky assumptions before we write a single line of production code.
It turns feature gambling into predictable, data-backed execution.
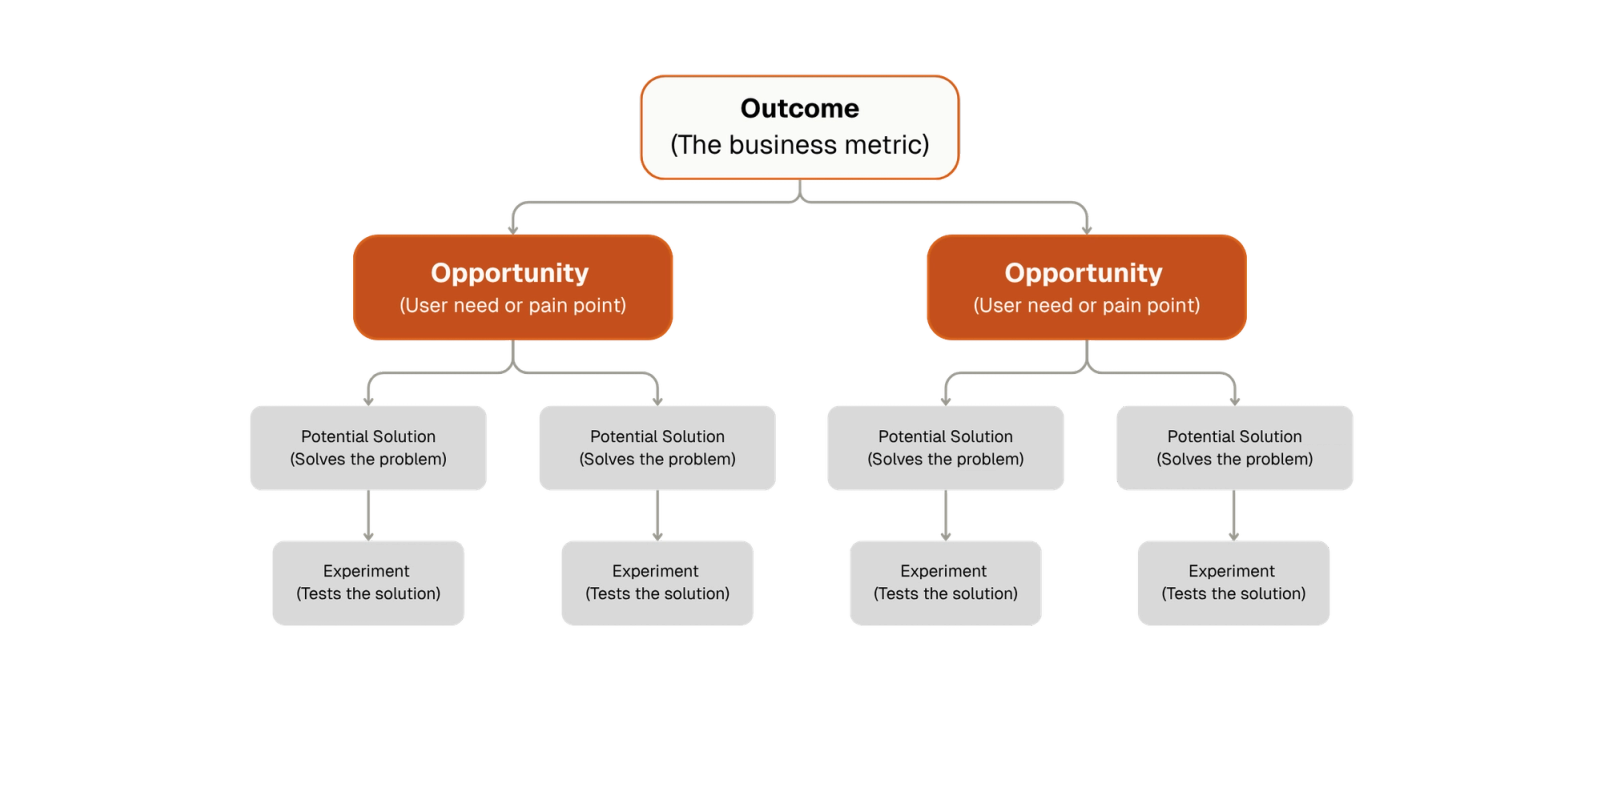
Instead of treating a feature request as the starting point, the team works backward from the outcome it wants to change, investigates customer opportunities, considers multiple solutions, and tests important assumptions before committing to delivery.
How Shorter Loop helps
Shorter Loop supports outcome-led product management and helps you carry the reasoning further. It connects objectives, opportunities, solutions, experiments, delivery work, and outcomes in one place, with evidence and assumptions that inform them.
01
The result you want to achieve
02
Customer problems or needs drawn from evidence. Solving these customer problems potentially lead to the desired result.
03
Multiple options, each with assumptions, that will potentially solve the customer problems identified in the previous step
04
Tests to run on assumptions inherent in the solutions to identify whether those assumptions are true. Tests help you identify the most effective solution.
05
Turn the selected solution into reality by delivering incremental and iterative slices of value. Each increment helps you learn more about your assumptions and customer preferences.
06
Did your solution work? What did we learn about our assumptions and customer preferences?
Real anonymized example
The story below is anonymized, but real. The individual parts matter less than how they work together. Here is one customer example from the first business objective through opportunity discovery, prioritization, experiments, solution selection, and the roadmap.
Customer story Solveo · one planning cycle
In January the board handed Solvio three objectives. By the end of February the team had a strategy, a roadmap, and a written answer on which of the board's own assumptions held up. Every step happened in Shorter Loop.
| Company | Customers | ARR | Planning window |
| B2B customer-support platform | 214 | $4.45M | 7 weeks |
STEP 01
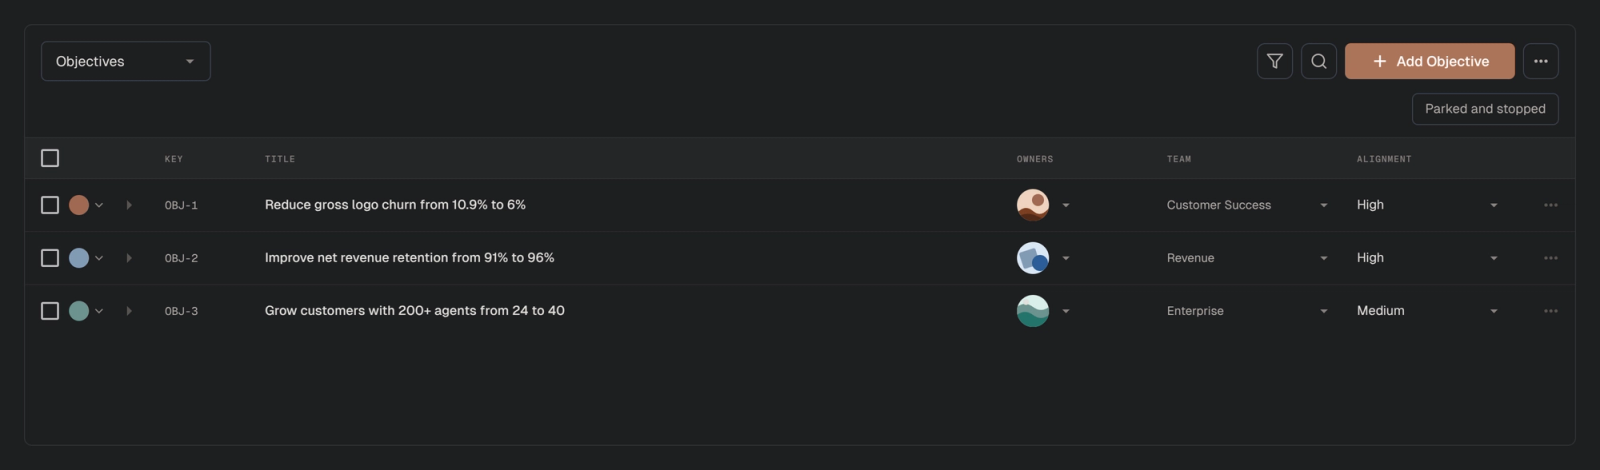
STEP 02
Nobody re-typed anything. Sage read each source, broke it into claims, and linked every claim to the evidence behind it.
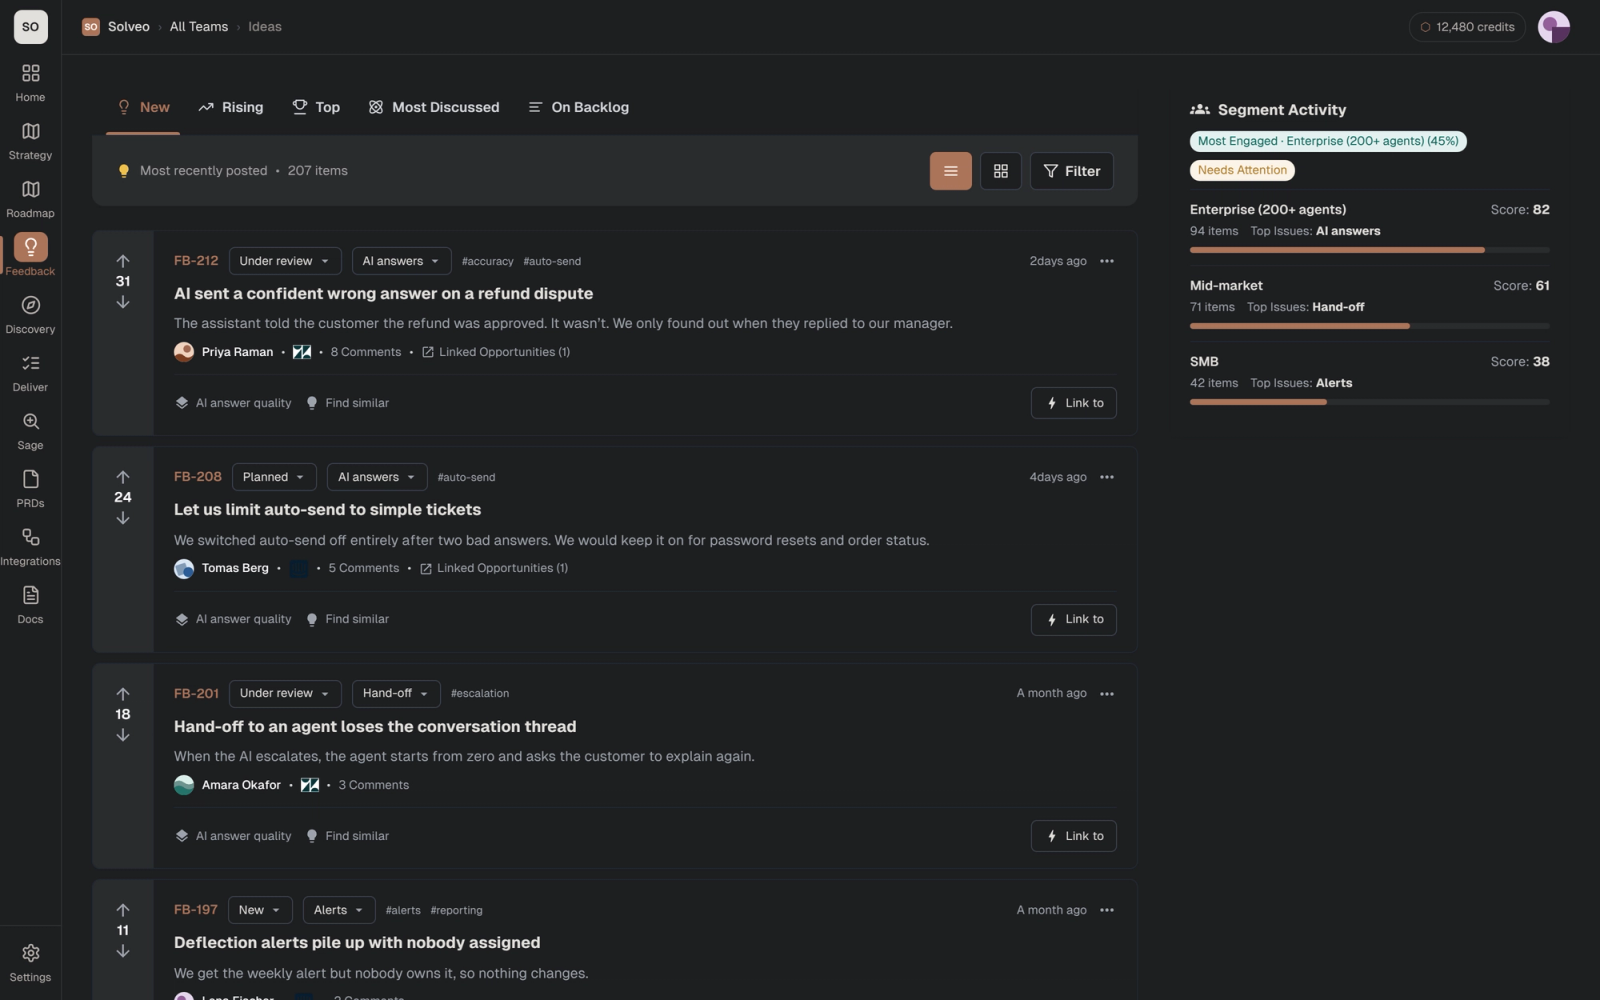
STEP 03
Each opportunity came back with its evidence trail and a state. The strongest had five independent kinds of evidence behind it.
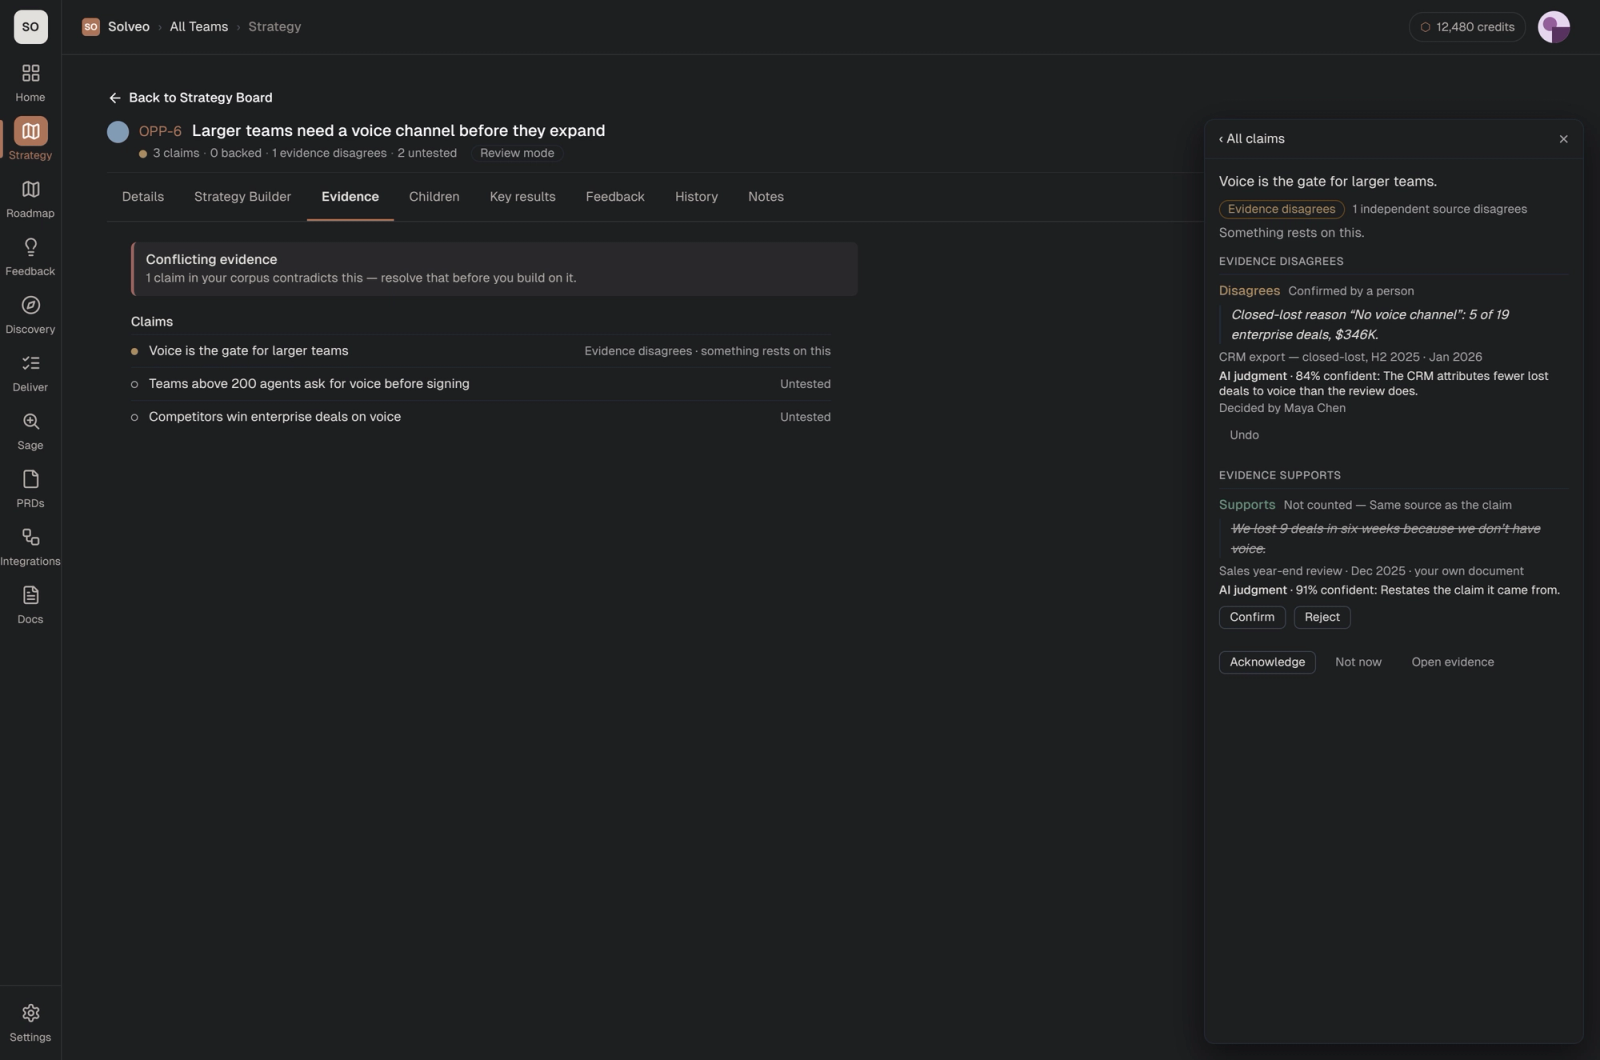
STEP 04
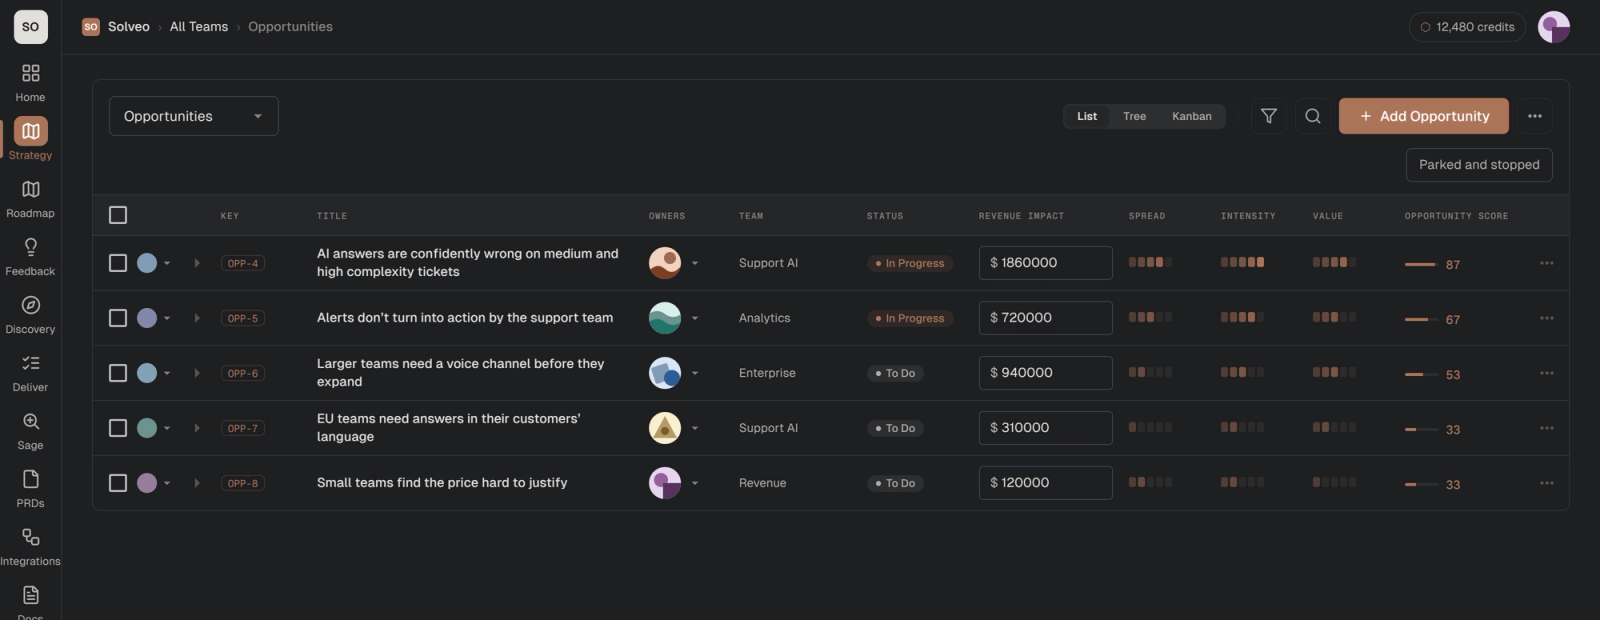
Every opportunity gets a score from three things: how many customers have the problem, how much it hurts them, and how much revenue sits behind it. Value came straight from the accounts: each feedback item carries the revenue of the customer who sent it, so a complaint from a 400-agent team counts for more than one from a trial.
STEP 05
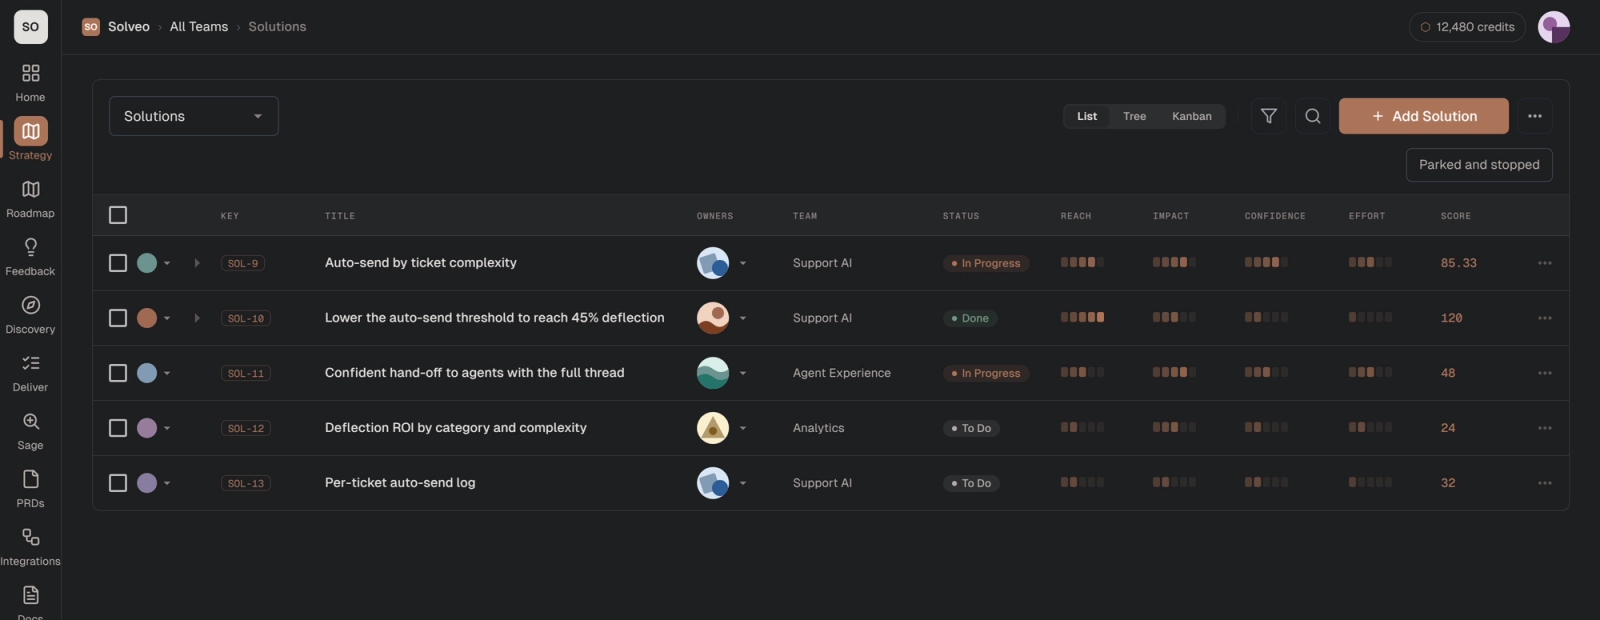
Sage proposed solutions for the top opportunity and the team added one of its own. The Confidence column in RICE is set by the evidence state.
Lowering the threshold scored high because it costs a week. That is exactly why it got tested first.
STEP 06
Each experiment had its success bar written down before it started. When the readouts were uploaded, Sage rechecked the claims they touched and the solution cards changed state on their own.
6 ACCOUNTS · 4 WEEKS
8 ACCOUNTS · 4 WEEKS
STEP 07
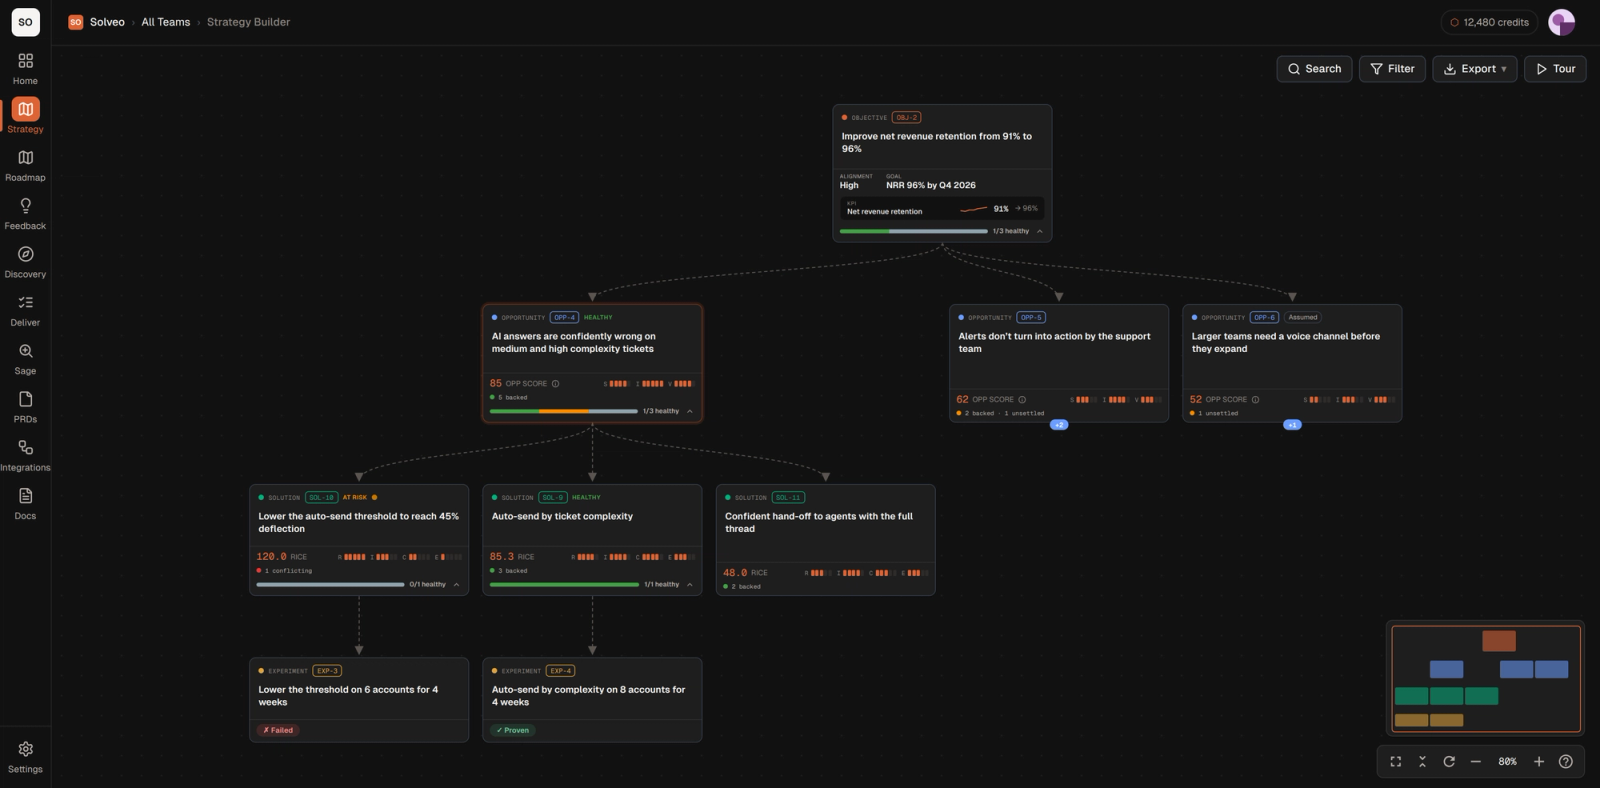
The VP of Product could show the objective, the original assumption, the evidence that changed it, the alternatives considered, the experiment, the work that shipped and the metric that moved — without rebuilding the story in a presentation.
Bring the evidence you already have. Shorter Loop helps you connect it to the objective, distinguish evidence from assumptions, and see what needs to be tested next.
This page uses an anonymized customer example. You can open the demo to inspect the example used throughout the page.